1/4/2018
Subsequent to posting this article, I learned from a school district fiscal officer that there were two errors included in my calculations. The first was the use of Table 19 in the OSPI Personnel Report. That data is just limited to certificate teachers. I should have used Table 34B, which includes all certificated instructional staff. The second error was not accounting for the grandfathered, higher salary allocation which is currently received by twelve school districts. Those higher amounts were removed in my subsequent analysis, so the data only reflects the change from an allocation based on the staff mix formula to one based on a statewide average allocation. Those corrections have been made in the original article below. They do little to change the big picture I addressed, but they make more significant differences for some of the individual school districts highlighted in the article. I apologize for any confusion caused by these errors.
Subsequent to posting this article, I learned from a school district fiscal officer that there were two errors included in my calculations. The first was the use of Table 19 in the OSPI Personnel Report. That data is just limited to certificate teachers. I should have used Table 34B, which includes all certificated instructional staff. The second error was not accounting for the grandfathered, higher salary allocation which is currently received by twelve school districts. Those higher amounts were removed in my subsequent analysis, so the data only reflects the change from an allocation based on the staff mix formula to one based on a statewide average allocation. Those corrections have been made in the original article below. They do little to change the big picture I addressed, but they make more significant differences for some of the individual school districts highlighted in the article. I apologize for any confusion caused by these errors.
One of the great mistakes is to judge policies and programs by
their intentions rather than their results.
- Milton Friedman
their intentions rather than their results.
- Milton Friedman
As we enter 2018, a few things seem clear regarding recent changes to Washington’s school funding system. First, based on the Court’s November 15 order, the McCleary lawsuit has ended in all areas except the timing of the state’s increased salary allocations. Second, the lawsuit has resulted in significant increases in the state’s funding of basic education. Even with those increases, however, most school districts will see a big reduction in the discretionary funds available to sustain existing priorities. And finally, EHB 2242 has many flaws that will likely increase, rather than decrease, the funding inequities between school districts across the state.
My first superintendent position began in 1996, and in that role, I became very familiar with the state’s education funding system. Much of that system came about as a result of the 1977 Doran Decision and subsequent State Supreme Court decision that confirmed the lower court ruling. As a new superintendent working through the budgeting process, I quickly became aware of a positive and a negative aspect of the funding system created by the Legislature in response to the Doran Decision.
The negative, and totally inexplicable part of the formula, was the amount each school district received for administrative and classified staff salaries. Those allocations for 2000-01 are provided in LEAP Document 2. In that table, the district with the highest allocation for administrative staff received $69,384. While that likely wouldn’t have covered most district’s administrative costs at the time, it was much closer than the $28,467 received by the lowest funded district. The classified staff allocations exhibited similar disparity with $29,947 at the high end, and $19,795 at the low end.
The most frustrating thing about this formula is that no rationale could be provided for the differences. The formula was merely an artifact of the rush with which the new funding system was created by the Legislature in the wake of the Doran Decision. The only explanation is that it was originally based on district staffing reports from the late 70s. Everyone seemed to agree that it was a mistake, but steps weren’t taken to address it until some three decades later; and while the differences are now smaller, they are still reflected in the current year allocations. Given the Legislature’s apparent inability to fix this obvious problem over the past four decades, one can’t help but wonder if they’ll do any better with the problems created in EHB 2242.
The positive aspect of the funding formula, I discovered as a new superintendent, was the teacher salary allocation which was based on each school district’s average teacher placement on the state salary schedule. This system was put in place following the Doran Decision to meet the Court’s directive that the state fund the actual cost of providing basic education. Given that genesis of the system, it is very ironic that the current Court accepted its elimination in EHB 2242.
That salary allocation formula was based on two schedules developed by the Legislative Evaluation & Accountability Program Committee (LEAP). The salary schedule is referred to as the Table of Total Base Salaries and is found in LEAP Document 1, which is displayed in Figure 1 below. The structure of this salary schedule has been relatively unchanged for four decades except for the increases provided by COLAs.
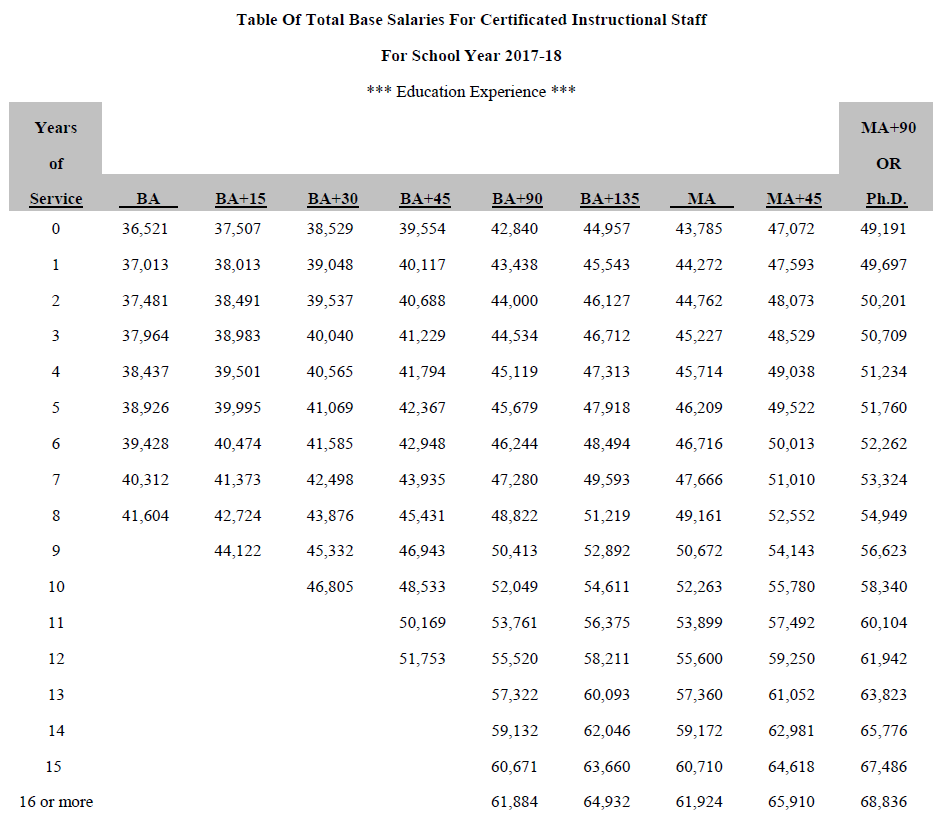
Figure 1
The staff mix formula is based on the Table of Staff Mix Factors, also found in LEAP Document 1 and shown below in Figure 2. That table expresses as a numerical factor the differences in salary amounts for each cell of the state salary schedule, with 1.00000 representing the starting cell, and 1.88482 the highest salary level in that grid.
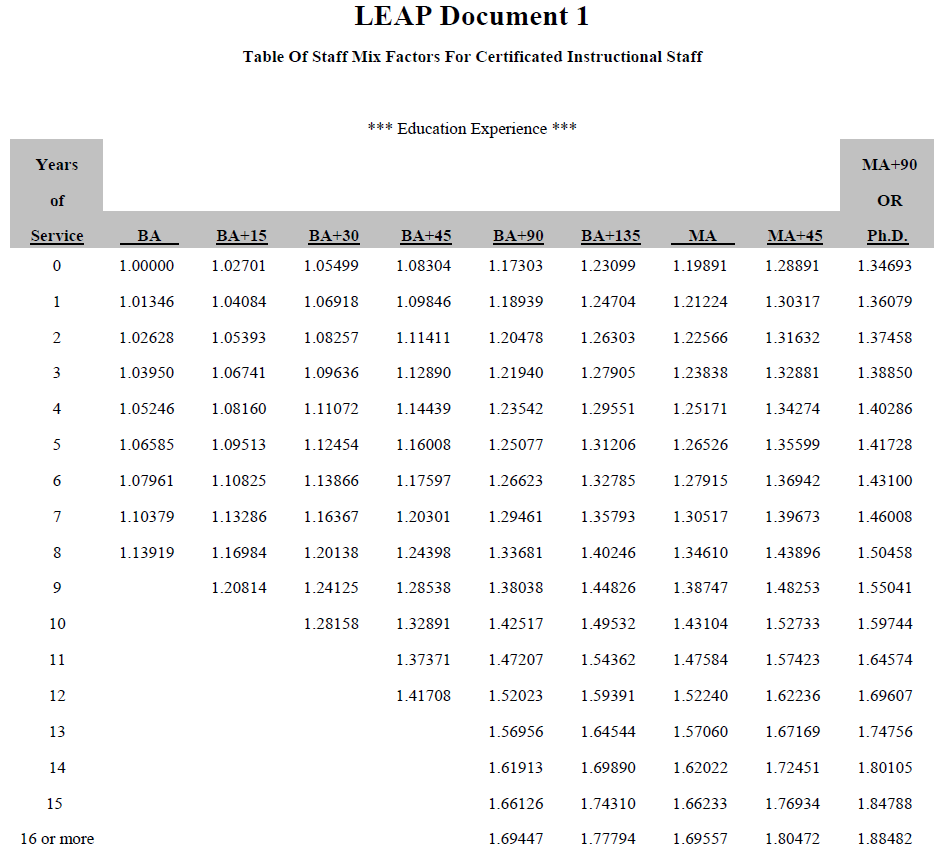
Figure 2
By averaging this mix factor for all the teachers in a school district, a number is derived that represents the district’s average teacher placement on the state salary schedule. That is the district’s mix factor which is multiplied by the salary amount in the first cell (BA + 0 Years of Service) to calculate the salary amount provided to the district for each allocated teacher.
According to the OSPI 2016-17 Personnel Report, Table 34B, the highest funded district that year had a staff mix of 1.88482 with an allocation of $67,288 per full time equivalent (FTE) teacher. The lowest funded district had a staff mix of 1.04753 with an allocation of $37,397 per FTE. While it may appear that this system incorporates similar inequity as found in the administrative and classified allocations referenced previously, there is a purpose for these differences. They reflect the differences in the actual amount needed to cover each district’s costs based on their teachers’ placement on the state salary schedule.
In EHB 2242, the Legislature did away with the state salary schedule and teacher salary allocations based on the staff mix formula. That system was replaced by a statewide average salary allocation. One ramification of that change is that each school district will be forced to create their own salary schedule. That will throw all 295 school districts into a chaotic bargaining process during the coming year. The most negative impact, though, is that the state’s teacher salary allocation for a majority of districts won’t cover the cost of paying their teachers' salaries.
For districts like Lake Washington, with a relatively low 2016-17 staff mix of 1.44126, that’s not such a challenging task. Their low mix factor that year created an allocation of $51,371 per FTE compared with the state average of $54,757. That difference is due to the fact that their teachers are relatively early in their career compared with the state average. As the state’s average allocation moves to $64,000 in 2019-20, the district will receive an increase per staff person of significantly more than the state average increase of about $10,000.
On the other hand, a district like Everett with a staff mix of 1.59140 has a more tenured teaching staff. As a result, their 2016-17 teacher salary allocation was $55,911 (with grandfathered amount removed) and was well above the state average. So, they are scheduled to receive an increase in 2019-20 that is significantly less than the $10,000 state average increase. As a result, Everett will find it very difficult to fund their salary costs with an allocation based on the statewide average.
The table in Figure 3 shows the range of this difference for thirty-four school districts that represent a cross-section of the state. The amount shown in Column C is what their total 2018-19 teacher allocation would be if the state’s $64,000 average allocation were adjusted based on the 2106-17 staff mix data. Column D shows the total allocation based on a straight $64,000 average allocation. Columns E and F show the total difference and the difference per teacher FTE. Based on this analysis, there are 166 districts that lose and 129 that gain with this change in the allocation formula.
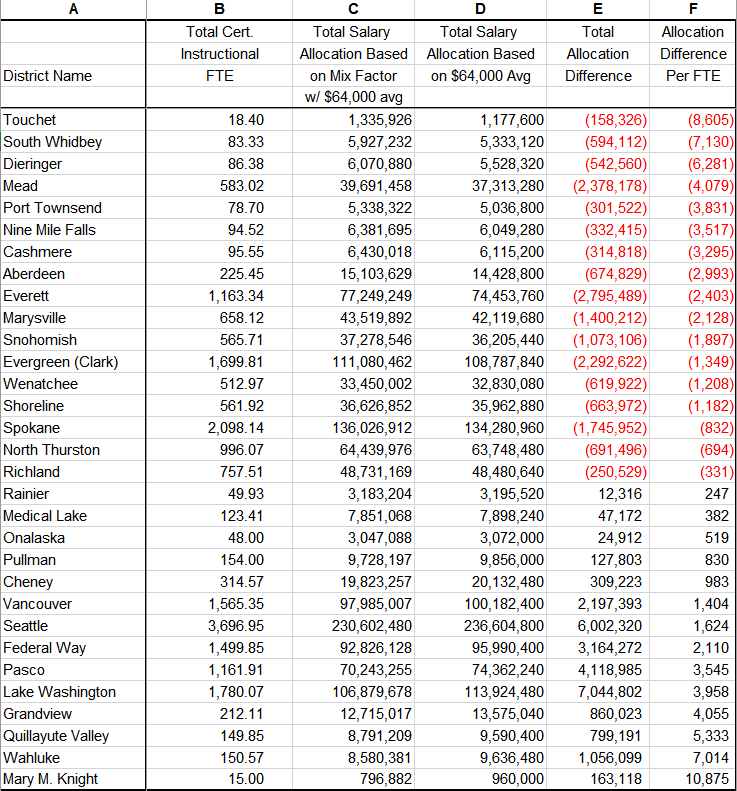
Figure 3
The more senior teaching staff in the losing districts have a reasonable expectation to have their salary increased by the same proportion that the state average increased. To meet that expectation, the leaders of those districts will have very limited options: a) use levy funds which were cut significantly by EHB 2242, b) divert other parts of the state allocation to cover salaries, or c) implement staff reductions. None of these options are what the leaders of those districts anticipated when our State Supreme Court ordered the state to amply fund the actual district cost of providing basic education.
It should be noted that for some districts, these salary allocation shortfalls will be offset by another change, additional funds provided through a regionalization factor. That factor is intended to address the higher cost of housing in some districts. While that added funding might help districts who lose out with an average salary allocation, only 93 school districts receive that additional funding.
Beyond the challenges faced by these districts who lose out in the new allocation system, this change also creates many negative consequences. For the first time in decades, there will be a perverse incentive for districts to hire younger, or less highly educated (e.g., less expensive) staff. That will also make it more difficult for experienced teachers to move from one district to another. And the lack of a consistent statewide schedule for base salaries could create even wider variability in what teachers with similar training and experience are paid from one district to another.
There are other inequities embedded within the details of EHB 2242 that I intend to highlight in upcoming articles. My question, as I highlight these issues, is whether legislators will have any inclination to address the unintended negative consequences of a bill that was drafted behind closed doors and rushed to a vote with no public input or scrutiny. If not, our schools will likely be forced to live with these problems for decades to come, as was the case following the Doran Decision. Only time will tell how long these problems will undermine the amply-funded, general, and uniform system of public schools required by our state constitution.

 RSS Feed
