As educators across the state begin to welcome students back to the start of another school year, there is a cloud hanging over our schools caused by the federally required NCLB failure letters that went to most parents in the state. I’m hopeful that these parents know our schools aren’t failing, but I’m not sure they know just how good they are.
During the past few weeks, I’ve been analyzing state comparisons on the 2013 NAEP Scores alongside the similar comparisons of state education funding and funding effort. That information tells a remarkable story about the powerful work our schools are doing in spite of difficult challenges.
Washington’s combined ranking for NAEP 4th and 8th grade math and reading is seventh in the nation. That’s not a one-year fluke, because we’ve been in the top ten for a while. When was the last time you heard a compliment from legislators, business leaders, or the media for that remarkable achievement? Let me take the opportunity to say “Way to go Washington educators!”
What is even more impressive is that we’ve accomplished that feat while being in the bottom 10 states in per student funding for more than a decade. The chart in Figure 1 shows Washington’s per student funding since 1995 compared with the nation and the average of the other top 10 NAEP performing states. It’s interesting to see that all three lines began in about the same place back in 1995 and the lines have continued to diverge. Talk about an achievement gap!
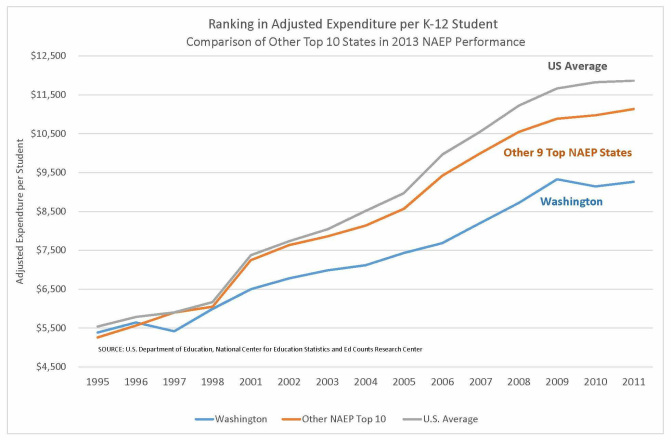
Figure 1
The chart in Figure 2 is even more telling. It uses the percent of taxable resources spent on K-12 education as the basis of comparison. That is a good measure for the effort each state is making to fund their public education system. Again, the 1995 starting point is pretty similar, but in this comparison the current gap is even larger.
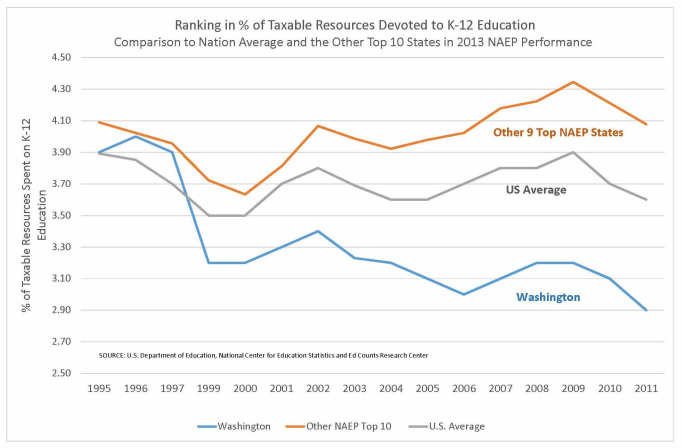
Figure 2
Given this data, it’s pretty clear that Washington’s public schools have delivered a tremendous return on investment. In an earlier article in this blog, I raised the question of how well we might perform if we were funded at the level of Massachusetts. When viewing the same data, others might come to the conclusion that since we’re doing so well, more funding isn’t needed. That’s because our overall achievement hides a huge problem within the NAEP data.
If one examines the gap in the performance between students living in poverty vs. those not in poverty, Washington’s 2013 data places us 33rd in the nation. More troubling, if you look at the change in that gap between 2003 and 2013, Washington ranks 45th in the nation. But even more troubling is the fact that the gap has grown during that decade in all four grade-subject testing combinations. Clearly, compared to other states, we are doing a terrible job in helping those students who most need the leg up that a good education could provide. They are the true victims of Washington’s inadequate funding of schools.
The chart in Figure 3 below would support that position. The ten states that are doing the best at closing the achievement gap have funding levels above the national average and about $3,000 more per student than Washington’s funding level.
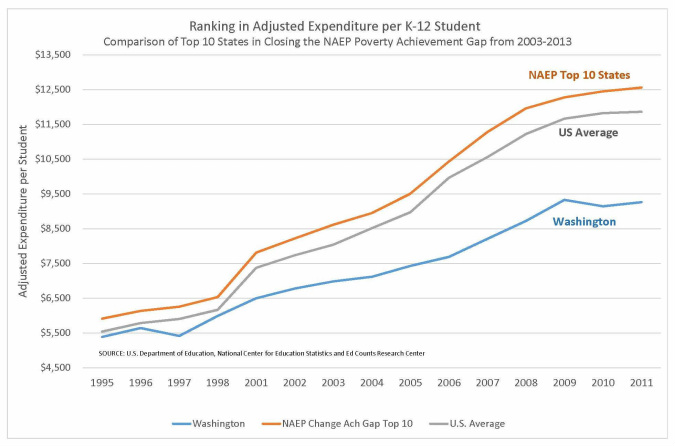
Figure 3
Based on the funding effort factor that is the basis for comparison in Figure 4, it is very clear that Washington has the capacity to provide much more help for these vulnerable students if only there was the political will to do so.
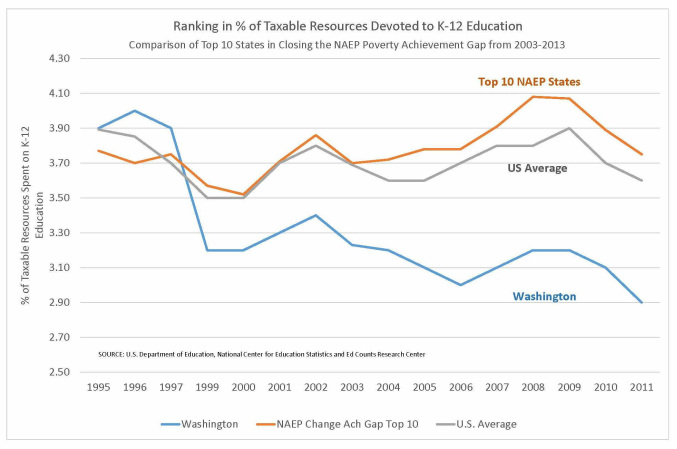
Figure 4
This will be a big year in the ongoing debates, action, and inaction regarding the McCleary Decision. I remain hopeful for an ultimate outcome that will begin to restore Washington to the stature it once had as a state that strongly supported its public schools. Until that happens, our most vulnerable students will continue to suffer most within our poorly funded system.

 RSS Feed
