In this world, you get what you pay for.
― Kurt Vonnegut, Cat's Cradle
― Kurt Vonnegut, Cat's Cradle
A recent series of articles in the Seattle Times Ed Lab did a great job of explaining why Massachusetts’ public schools do so much better than Washington’s schools. It should be required reading for anyone seeking or holding legislative office. In a follow-up column, Danny Westneat addressed the source of the problem facing our public schools, “The question going around is: Why do our schools lag behind those in the similar state of Massachusetts? There’s a one-word answer: leadership.”
The subtext of the leadership issues Westneat identified in his column is the apparent lack of political will related to taxes. The chart in Figure 1 produced by OSPI, shows how that has impacted Washington’s standing among the states in relation to one measure, funding per student. The difference between the NCES and Quality Counts lines is that the later data from Education Week adjusts expenditures for cost of living differences between the states.
The subtext of the leadership issues Westneat identified in his column is the apparent lack of political will related to taxes. The chart in Figure 1 produced by OSPI, shows how that has impacted Washington’s standing among the states in relation to one measure, funding per student. The difference between the NCES and Quality Counts lines is that the later data from Education Week adjusts expenditures for cost of living differences between the states.
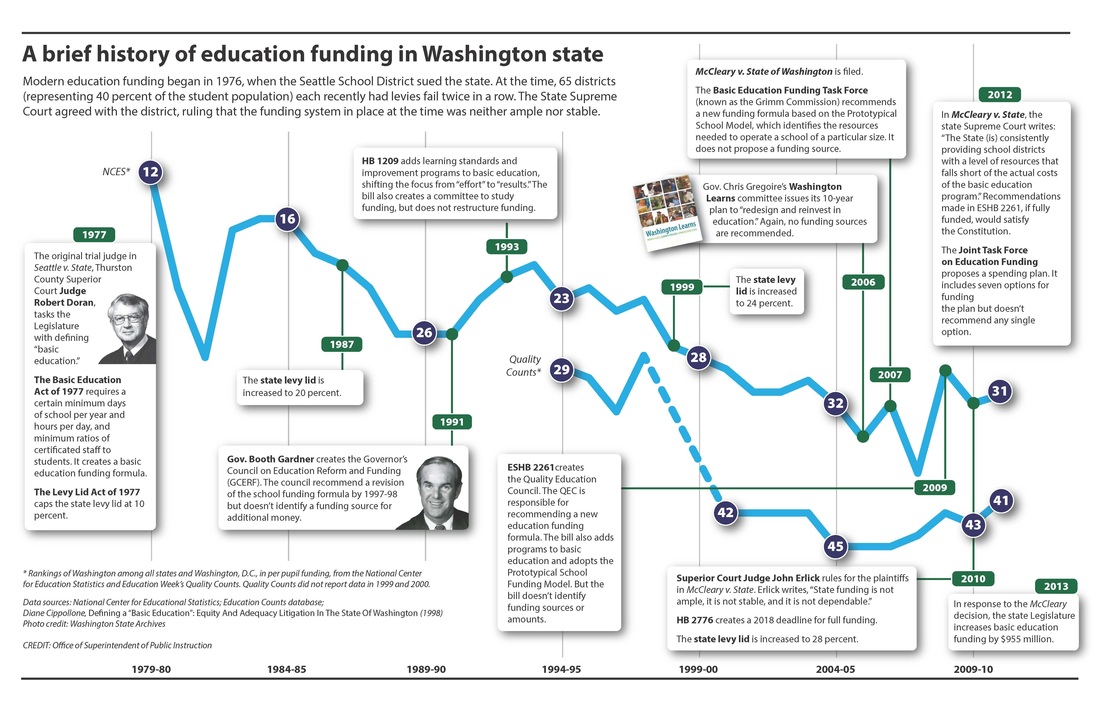
Figure 1
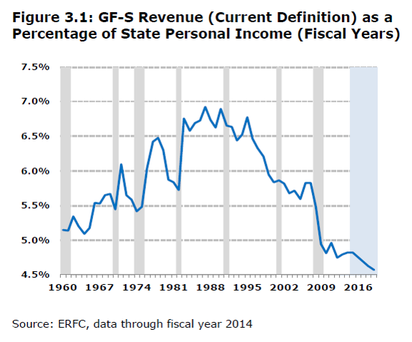
The decline in per student funding since 1980 shown in Figure 1 is mirrored by a similar drop in state revenue that’s reflected in Figure 3.1. That data is from our state Economic and Revenue Forecasting Council. It shows that in 2009, our state revenue as a percent of personal income hit the lowest point in over fifty years, and it’s still declining. This should make the anti-tax folks happy, but instead, they are trying to force an even greater decline.
In his column, Westneat cited data contained in the recently released National Report Card, produced by the Education Law Center in the Rutgers University Graduate School of Education. That report compares and ranks states on various indicators that help evaluate “the extent to which state finance systems ensure equality of educational opportunity for all children, regardless of background, family income, place of residence, or school location.”
It may come as little surprise that Washington is near the bottom of the barrel in most of these comparisons. In the summary below, I’ve provided the five-year trend of Washington’s Report Card rankings in some of the key indicators used in the report.
Staffing Fairness
This indicator is a highpoint for Washington in the 2016 Report Card. It compares the number of teachers per 100 students in high and low poverty districts.

If one digs a little deeper into this data, however, the results are not so promising. The starting point of the calculation is the overall student-teacher ratio (teachers per 100 students), which is then compared to schools with high concentrations of poverty. In that starting point, Washington’s overall ratio is among the worst in the nation. So the reason our staffing is relatively fairer than in many states, is that it is equitably bad in both high and low poverty schools.

Early Learning
This factor measures the enrollment rates of low income 3 and 4 year-olds in preschool as compared with the state’s overall enrollment rate. Such early access to learning is the best way to help students living in poverty catch up with their peers before entering kindergarten. Once again, Washington is at the bottom of the barrel. Given the ranking of 51 in two of those years, it should be noted that Washington D.C. is included in this data.
This factor measures the enrollment rates of low income 3 and 4 year-olds in preschool as compared with the state’s overall enrollment rate. Such early access to learning is the best way to help students living in poverty catch up with their peers before entering kindergarten. Once again, Washington is at the bottom of the barrel. Given the ranking of 51 in two of those years, it should be noted that Washington D.C. is included in this data.

Wage Competitiveness
Given the teacher shortage crisis facing our state, this is a very important indicator. It compares teachers’ salaries to the salaries of other professionals in the same labor market and of similar age, degree level, and hours worked. The aggregate measure includes separate comparisons of teachers at age 25 and 45.
Given the teacher shortage crisis facing our state, this is a very important indicator. It compares teachers’ salaries to the salaries of other professionals in the same labor market and of similar age, degree level, and hours worked. The aggregate measure includes separate comparisons of teachers at age 25 and 45.

Funding Capacity
This is an indicator that I calculated using the data provided in the report. It is based on the Per Capita Gross State Product reflected in 2009 dollars. Based on that measure, Washington has one of the top economies in the nation. Because of that capacity, one might expect relatively strong support for our public schools.
This is an indicator that I calculated using the data provided in the report. It is based on the Per Capita Gross State Product reflected in 2009 dollars. Based on that measure, Washington has one of the top economies in the nation. Because of that capacity, one might expect relatively strong support for our public schools.

Funding Effort
This indicator explains all of the other embarrassing rankings listed above. It measures how well the state uses its economic capacity in support of public schools. The indicator is an indirect measure of the preoccupation of our citizens and politicians over the past few decades in making lower taxes the highest priority for the state.
This indicator explains all of the other embarrassing rankings listed above. It measures how well the state uses its economic capacity in support of public schools. The indicator is an indirect measure of the preoccupation of our citizens and politicians over the past few decades in making lower taxes the highest priority for the state.

The Legislature has squandered its time this session, choosing to push the question of education funding into 2017. Next year’s session will be lawmakers’ last chance to address the issue before the Supreme Court’s 2018 deadline. That will be a critical year for our politicians and citizens alike to decide what kind of state Washington will be in the future.
Will our claim to fame be quality schools or the continued strangling of government services created by a declining tax burden? Will we return the state’s education system to its former high ranking within the nation, or will we accept a second-class education that doesn’t support students who come to school without the advantages of more affluent children? Washington’s citizens face a critical historic juncture in the coming years. Regardless of the direction they choose, my hope is that it is based on the kind of solid facts provided above rather than the simplistic catch phrases that characterize much of the current political discourse.
Will our claim to fame be quality schools or the continued strangling of government services created by a declining tax burden? Will we return the state’s education system to its former high ranking within the nation, or will we accept a second-class education that doesn’t support students who come to school without the advantages of more affluent children? Washington’s citizens face a critical historic juncture in the coming years. Regardless of the direction they choose, my hope is that it is based on the kind of solid facts provided above rather than the simplistic catch phrases that characterize much of the current political discourse.

 RSS Feed
