Education is the key to unlock the golden door of freedom.
- George Washington Carver
- George Washington Carver
The opportunity or achievement gap is certainly a trending topic in current education literature. Countless studies have shown lower levels of school success among students of color and low income. Given the increasingly bleak economic reality faced by those who aren’t successful in our schools, closing that gap has become a primary focus of school leaders across the nation. Due to the importance of this topic, I plan to post multiple articles on the subject during the coming year. Our hope is that as the McCleary decision improves funding for school districts, the learning gap will become a top priority for school districts in the use of new revenues.
While the sense of urgency about the achievement gap is relatively new, there is a deep body of research on the topic extending back several decades. James Coleman’s landmark study, The Equality of Educational Opportunity, was submitted to President Lyndon B. Johnson and the Congress fifty years ago in 1966, as a requirement of the Civil Rights Act. That study, which is commonly referred to as the Coleman Report, found that student background and socioeconomic status had more impact on education outcomes than school resources.
Much of the research, going back to and including the Coleman Report, has focused on two interrelated aspects of the achievement gap: race/ethnicity and socioeconomic status. There’s good evidence regarding differential achievement based on both sets of variables, and therefore, studies of both factors could provide clues for closing the gap. In 2011, Sean F. Reardon of Stanford University produced a valuable report that tracks changes in the socioeconomic and black-white achievement gaps over six decades.
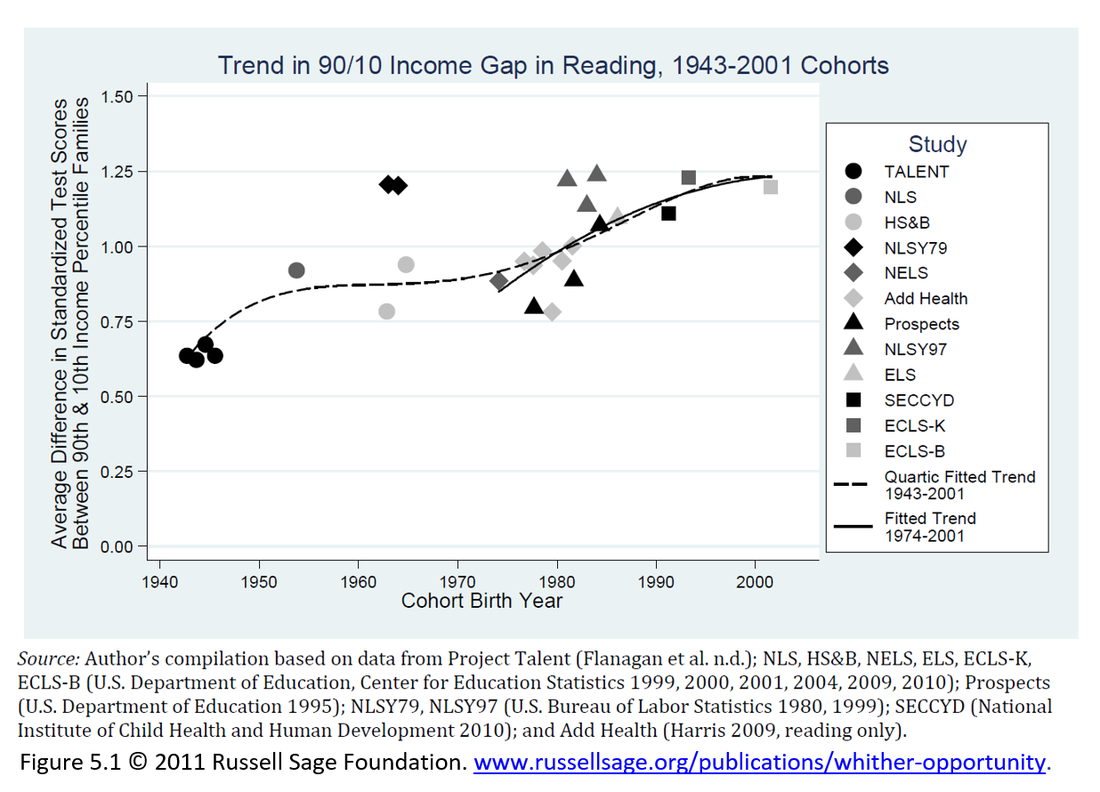
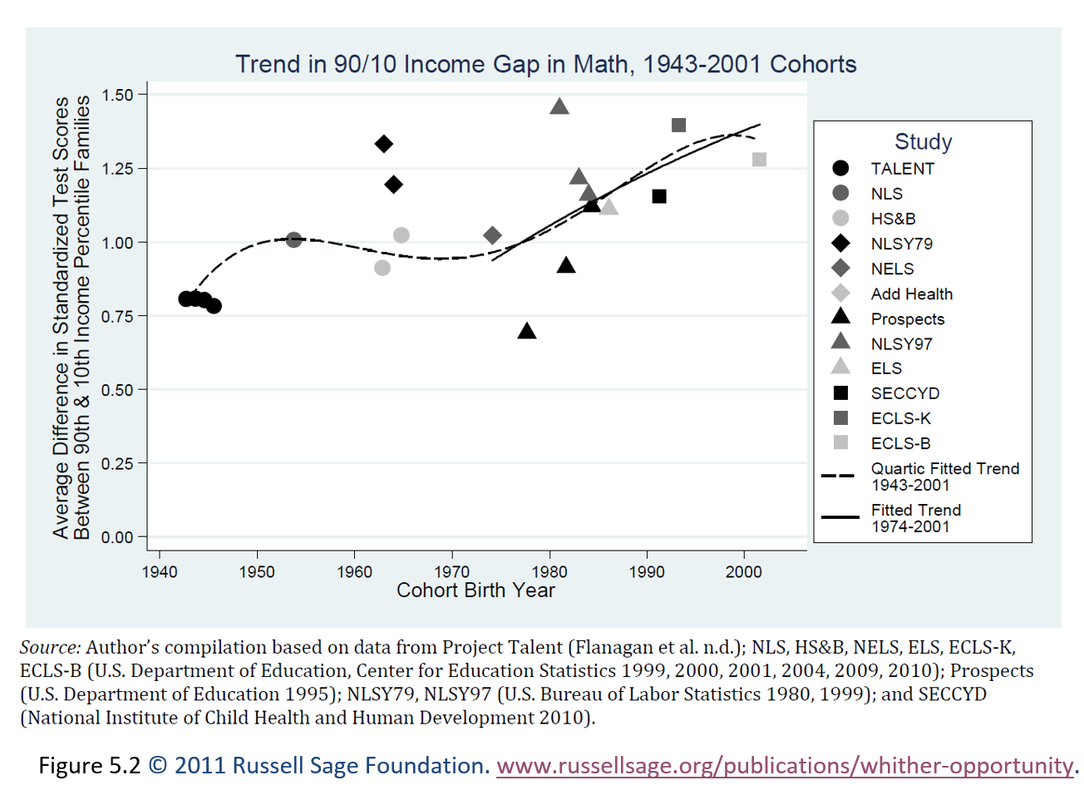
The charts in Figure 5.1 and Figure 5.2 illustrate the socioeconomic achievement gap trend in reading and math respectively. For the purpose of this piece, I suggest that readers disregard the various points in the graph and focus instead on the lines. Those trend lines reflect a growing gap in both subjects when comparing achievement of students at the 10th and 90th percentile of family income between 1943 and 2001. It should also be noted that the years are birth years, so 2001 reflects a student who is 15 years old in 2016.
The gap in these charts is measured in standard deviation units. Reardon provides a helpful explanation on how to interpret the size of the gaps with those units:
While the sense of urgency about the achievement gap is relatively new, there is a deep body of research on the topic extending back several decades. James Coleman’s landmark study, The Equality of Educational Opportunity, was submitted to President Lyndon B. Johnson and the Congress fifty years ago in 1966, as a requirement of the Civil Rights Act. That study, which is commonly referred to as the Coleman Report, found that student background and socioeconomic status had more impact on education outcomes than school resources.
Much of the research, going back to and including the Coleman Report, has focused on two interrelated aspects of the achievement gap: race/ethnicity and socioeconomic status. There’s good evidence regarding differential achievement based on both sets of variables, and therefore, studies of both factors could provide clues for closing the gap. In 2011, Sean F. Reardon of Stanford University produced a valuable report that tracks changes in the socioeconomic and black-white achievement gaps over six decades.
The charts in Figure 5.1 and Figure 5.2 illustrate the socioeconomic achievement gap trend in reading and math respectively. For the purpose of this piece, I suggest that readers disregard the various points in the graph and focus instead on the lines. Those trend lines reflect a growing gap in both subjects when comparing achievement of students at the 10th and 90th percentile of family income between 1943 and 2001. It should also be noted that the years are birth years, so 2001 reflects a student who is 15 years old in 2016.
The gap in these charts is measured in standard deviation units. Reardon provides a helpful explanation on how to interpret the size of the gaps with those units:
One way to get a sense of the size of the gaps is to compare them to the amount that an average student learns during the course of a year. Data from the NAEP indicate that the average student gains 1.2 to 1.5 standard deviations in math and reading between fourth and eighth grade and between 0.6 and 0.7 standard deviations in math and reading between eighth and twelfth grade. Thus, a gap of 1 standard deviation is substantively very large, corresponding to roughly 3 to 6 years of learning in middle or high school. (pg. 10)
Given that explanation, the trend lines in Figures 5.1 and 5.2 highlight a troubling and growing gap in the achievement levels of America’s high and low-income students. In fact, the income-based achievement gap was higher in 2001 than at any time in the previous six decades, and it represented on average, several years of lost learning for low income students. That is a sobering statistic for any educator to consider.
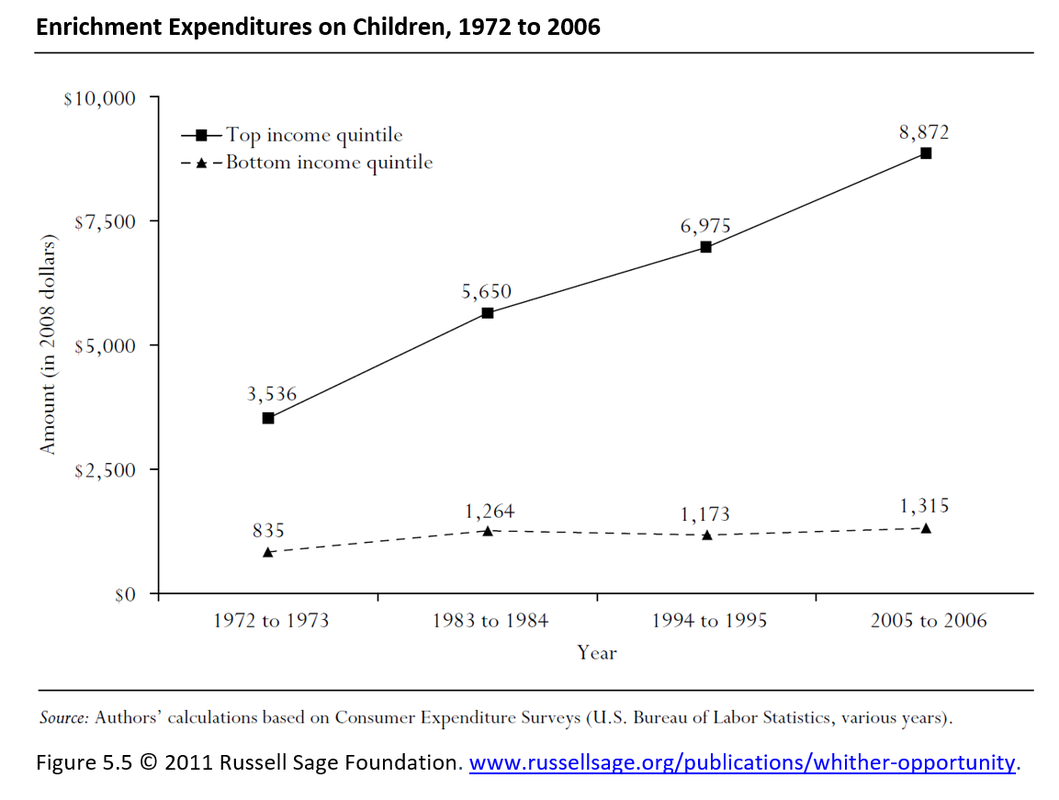
Regarding the reason for the growing gap, Reardon suggests that “this may be in part a result of increasing parental investment in children’s cognitive development” (pg. 5), among the upper income families. If so, it truly is an opportunity gap, or as one colleague recently said, it’s an experience gap. The chart in Figure 5.5 below is based on research by Greg Duncan and Richard Murnane. It shows the growing gap in spending on children’s enrichment between families in the top and bottom quartiles of income.
Another factor in this income-based trend is what Reardon identifies as increased residential segregation by levels of income:
Greater residential income segregation may affect the school-quality differential between high- and low-income students, because high-income parents are better able to garner resources for their schools. (pg. 24)
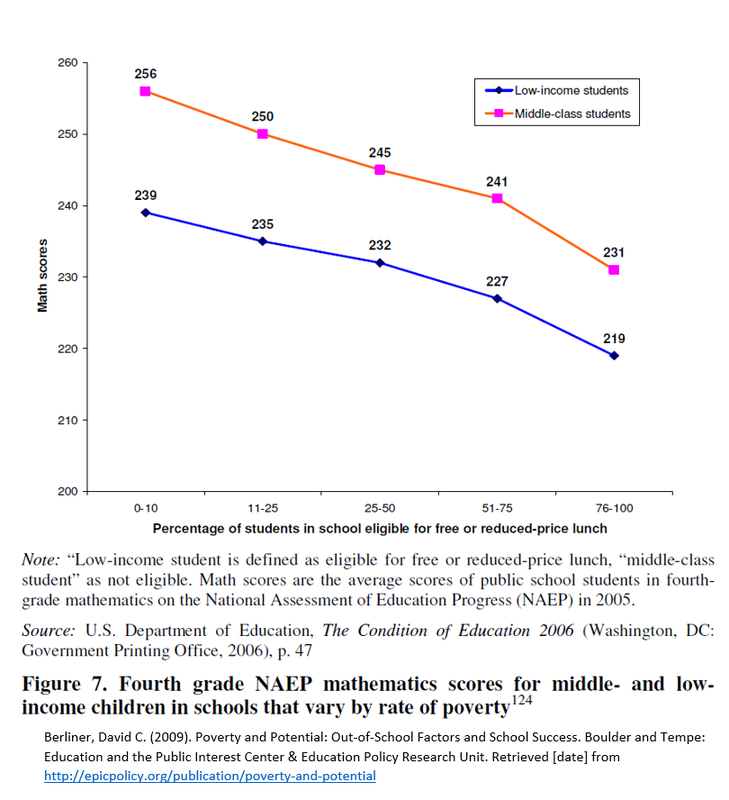
Hopefully, that is an issue that the McCleary case in Washington State will help resolve. Unless that happens, students in affluent school districts will continue to benefit from greater learning supports, both in school and at home, than students living in property-poor school districts. And the concentration of poverty in itself creates added learning challenges for the students in those schools.
David Berliner highlights that issue in the chart in Figure 7. At first blush, it doesn’t appear much different from any other graph that demonstrates the inverse relationship between achievement and poverty. But Berliner is showing the achievement of low-income and middle-income students within various levels of school poverty. The stunning takeaway in this data is that middle-income students do worse in high-poverty schools than low-income students do in affluent schools. Clearly, context matters.
David Berliner highlights that issue in the chart in Figure 7. At first blush, it doesn’t appear much different from any other graph that demonstrates the inverse relationship between achievement and poverty. But Berliner is showing the achievement of low-income and middle-income students within various levels of school poverty. The stunning takeaway in this data is that middle-income students do worse in high-poverty schools than low-income students do in affluent schools. Clearly, context matters.
In Figures 5.3 and 5.4, Reardon goes on to compare the income-based gaps already referenced with the black-white achievement gap during the same time frame. In those charts, the dashed lines represent the black-white trend, and the solid lines represent the income gap.
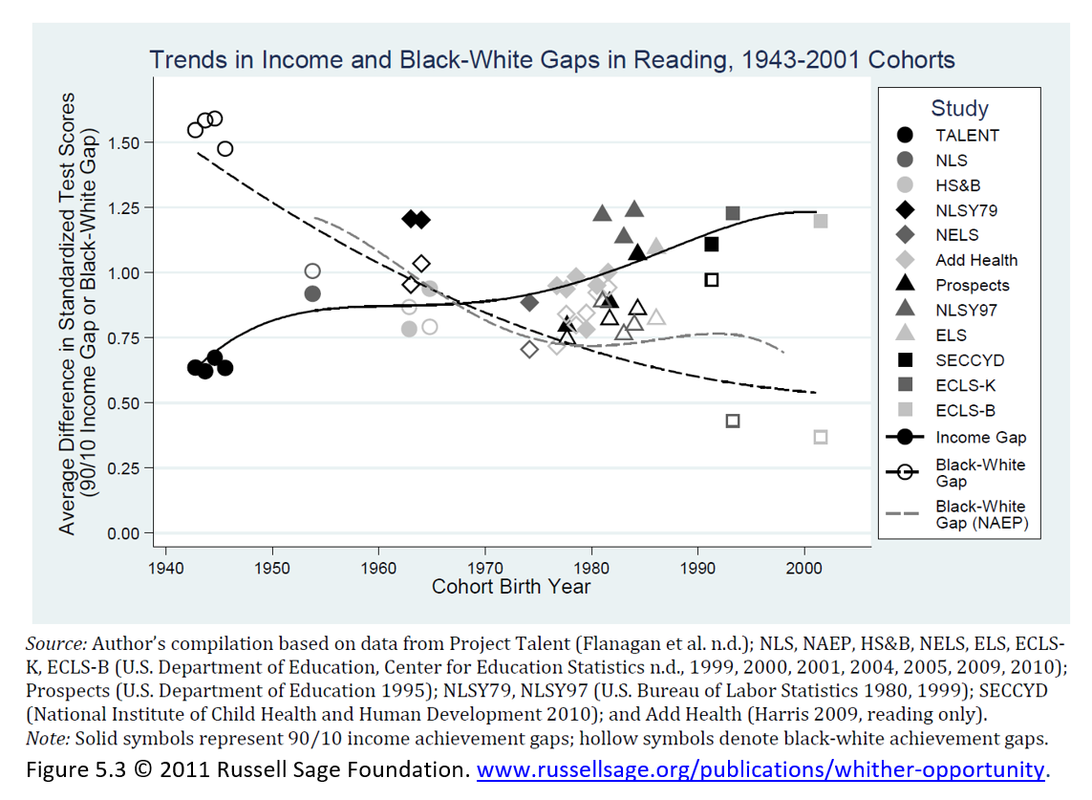
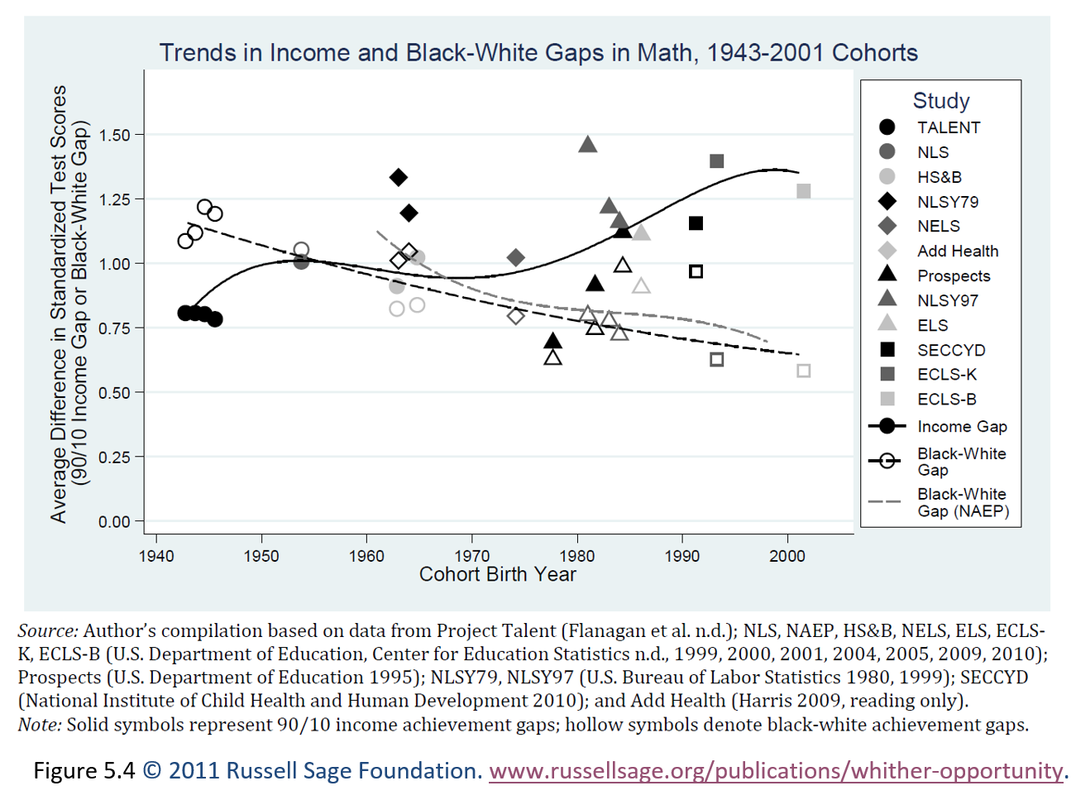
The good news with this information is that rather than growing, the black-white achievement gap has closed significantly during those six decades. Even with that progress, however, much more must be done. For students born in 2001, the black-white gap was still over 0.5 standard deviations for both reading and math. Applying Reardon’s standard deviation yardstick, that gap still represents a few years of learning difference. Given this data, it should come as little surprise that black students on average have a much lower graduation rate than their white counterparts.
It should also be noted that this data reflects averages, and there are many lighthouse school districts that have made tremendous progress toward eliminating achievement gaps among the students they serve. Our hope is that all schools will make this issue their highest priority, and in doing so, will learn from the successes others have achieved. Until that happens the door to freedom and prosperity will remain locked for many of our most vulnerable citizens.
It should also be noted that this data reflects averages, and there are many lighthouse school districts that have made tremendous progress toward eliminating achievement gaps among the students they serve. Our hope is that all schools will make this issue their highest priority, and in doing so, will learn from the successes others have achieved. Until that happens the door to freedom and prosperity will remain locked for many of our most vulnerable citizens.

 RSS Feed
